Search + AI visibility · Hospitality
More ways to find Gjelina Hotel.

In October 2026, Gjelina Hotel recorded 2,084 visits from search and AI tools. Google clicks were up 30% from the same month a year earlier. The report also showed an upward trend in AI visits since June.
- Client
- Gjelina Hotel
- Field
- Hospitality
- Reporting period
- June to October 2026
- Evidence
- GA4 + Google Search Console
The hotel already had traffic before our work began. These observations do not prove that our work alone caused the changes. This study reports no booking count, revenue, or return on investment.
A separate visibility signal
Showing up in Google’s generative AI features.
The supplied Search Console view records impressions in this feature category. It does not report 10.3K visits, clicks, AI answers, or bookings.
The view includes time before the engagement and extends into November.
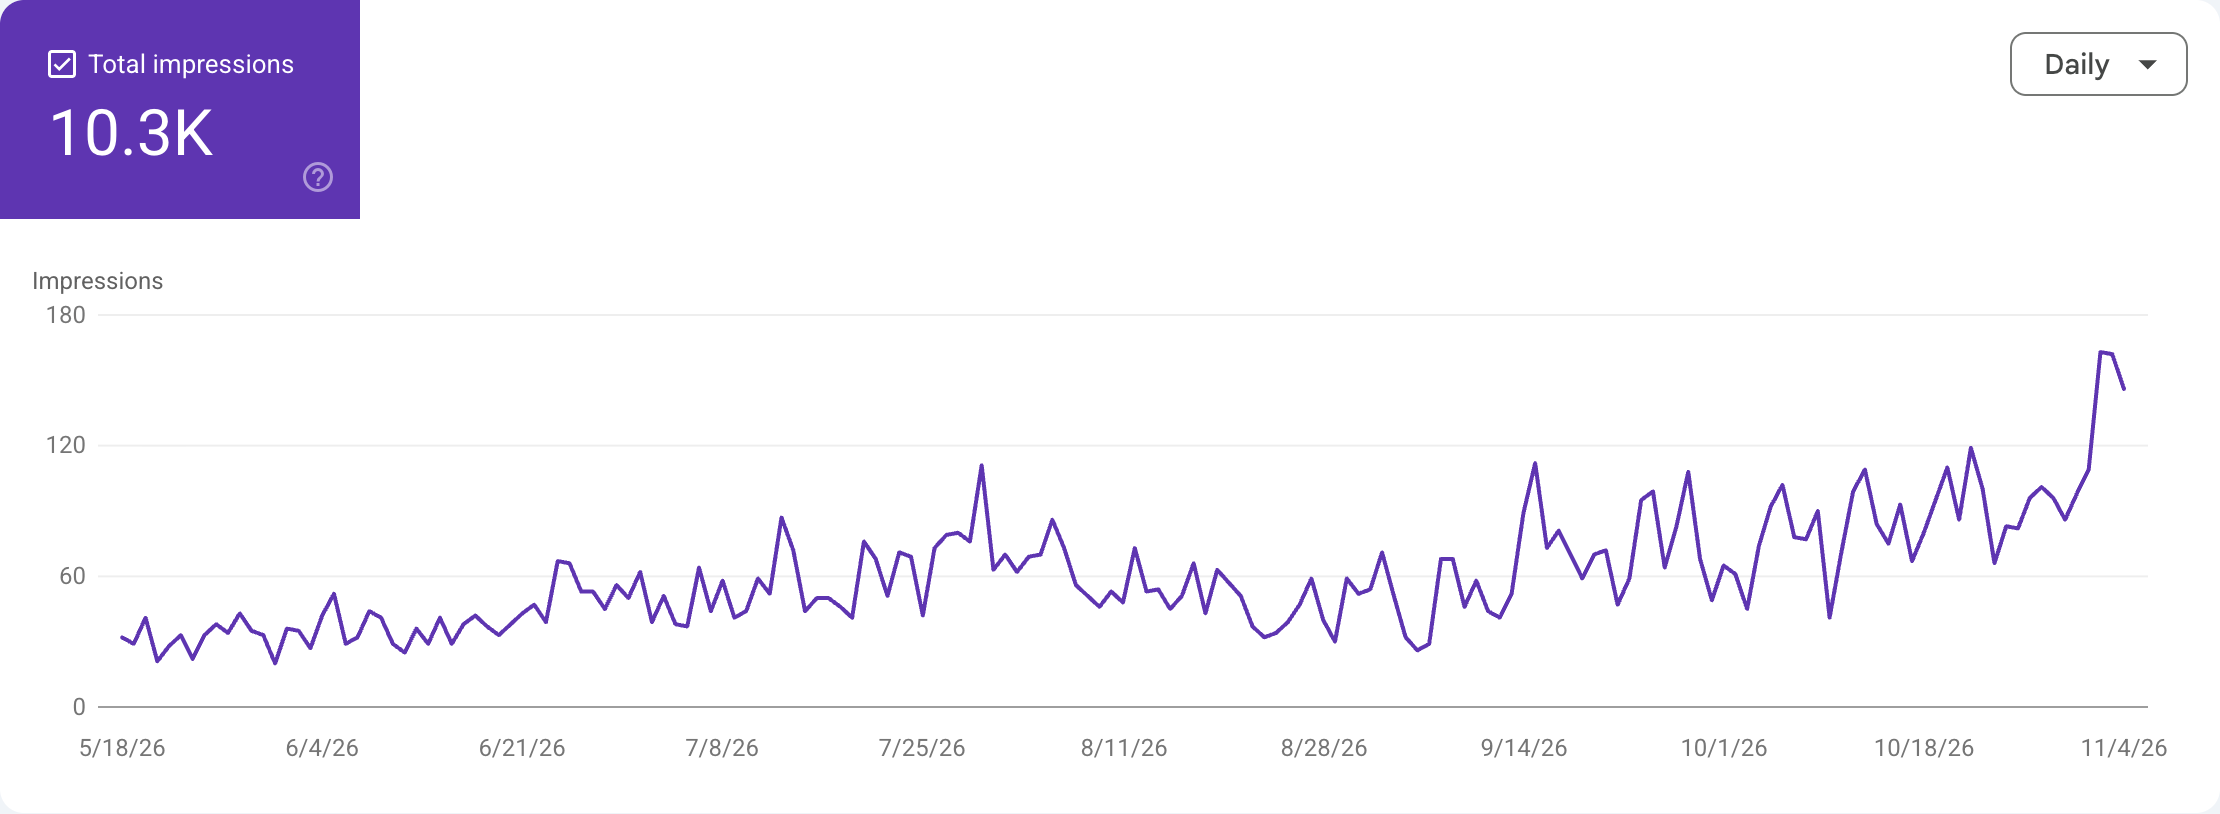
The original Search Console chart, cropped to remove account navigation. Its dates, scale, daily line, and total are unchanged. Scroll within the chart or open it full size to read every label.
Search + AI traffic
The search and AI traffic trends.
These figures come from the October 2026 client performance report. Each keeps its own source and comparison period.
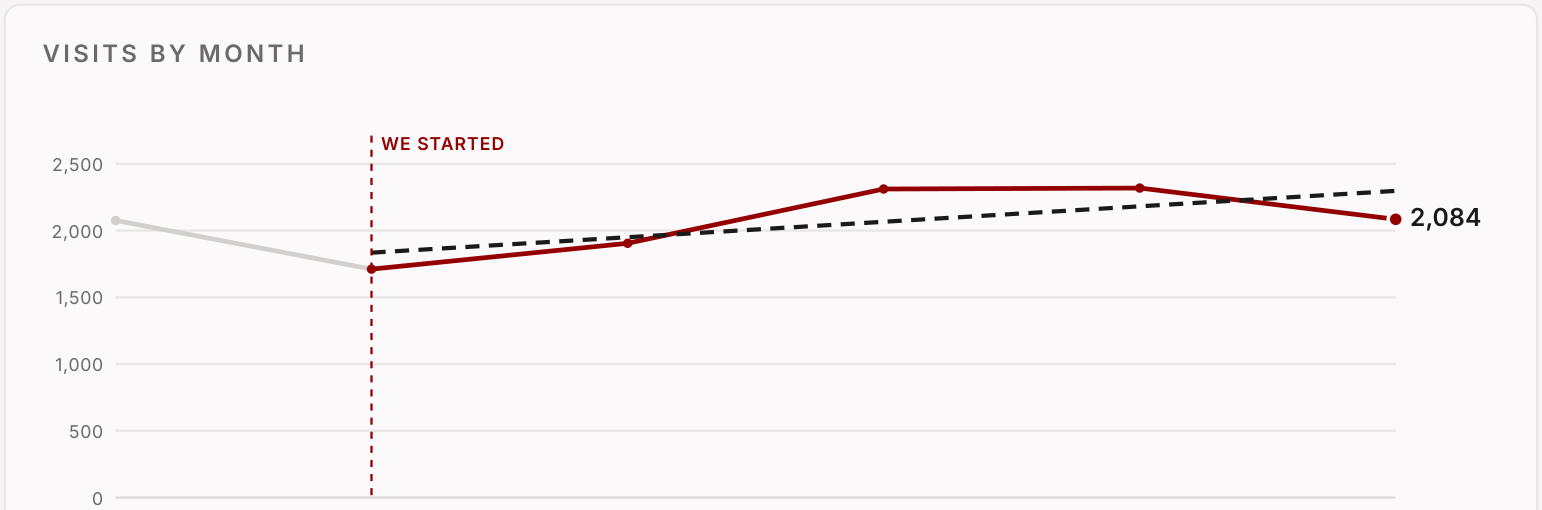
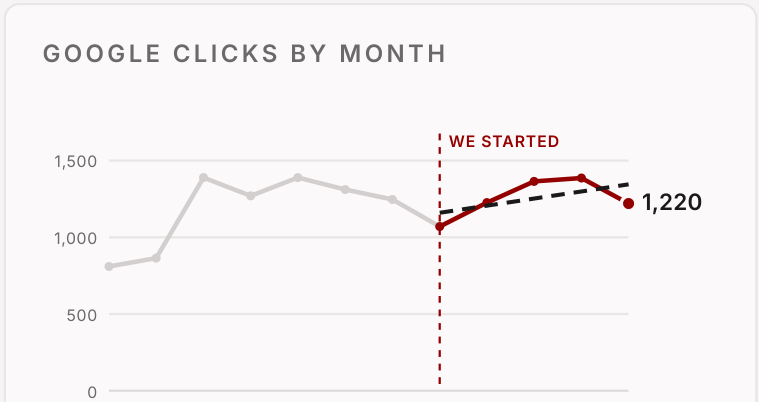
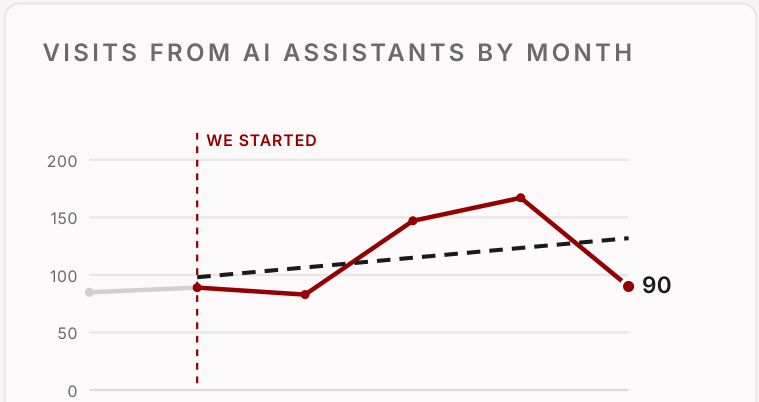
Monthly trends from the performance report, with calendar labels omitted. The plotted values and scales are unchanged. Gray lines show earlier months, the vertical marker shows when work began, and dashed lines show the reported trends. Reporting windows are listed in the sources below.
Search + AI visits
2,084
+25% trend since June
October 2026 · GA4
1,994 search visits plus 90 AI visits. These are visits, not bookings.
Google search clicks
1,220
+30% vs. October 2025
October 2026 · Search Console
The report also shows a +16% trend since June. Clicks are measured separately from GA4 visits.
AI-referred visits
90
+35% trend since June
October 2026 · GA4
86 came from ChatGPT. These 90 visits are already included in the 2,084 total.
Tracked searches improved
5 of 8
June to October 2026
Selected nonbranded searches
A small, tracked set of searches that do not include the hotel’s name. It does not represent every search.
How to read “trend.” The +25%, +16%, and +35% figures are the report’s trend measures since June. They are not month-over-month changes or simple June-to-October endpoint growth. The +30% Google click figure is a separate year-over-year comparison.
The starting point
An existing hotel with existing traffic.
Our work with Gjelina Hotel began around late May and early June 2026. The hotel already had a website and search traffic. This was an effort to build on that base.
We followed search visits, Google clicks, AI referrals, selected nonbranded searches, and the hotel’s journal. Comparing those measures helps separate people reaching the site from pages simply appearing in search or AI features.
The figures shown here cover observations through October, with a later Search Console view for Google’s generative AI features. They do not isolate which change caused each result.
Searches beyond the brand
Five of eight tracked searches improved.
The report followed a selected set of searches without the hotel’s name. One example was “venice beach hotels.”
Average position improved from 13 in June to 9 in October for this tracked search. An average position is not a fixed ranking for every guest or search.
The hotel journal
Early visibility, with a clear gap.
The October report recorded 1,064 Google impressions and 9 AI answers linking to journal posts. It had not yet recorded Google clicks to those posts.
Those are signs that the posts were being surfaced. They are not evidence of visits from Google, bookings, or revenue. Keeping that distinction makes the next report useful: did visibility turn into visits?
Sources and limits
What the numbers can tell us.
October performance report
GA4 supplied the reported search and AI visits. Google Search Console supplied search clicks and average positions. The visit charts cover May to October 2026. The Google click chart covers November 2025 to October 2026. Calendar labels are omitted from those charts; the monthly points and scales are unchanged. The report also tracked journal impressions and AI answers linking to its posts.
A different window for Google AI
The 10.3K impressions come from the supplied six-month Search Console view labeled “Generative AI features (Beta).” That is a separate source and time window from the October visit totals.
No conversion or causal claim
The hotel already had traffic before our work began. These observations do not prove that our work alone caused the changes. This study reports no booking count, revenue, or return on investment. Seasonality, existing demand, and other changes can affect results.
Selected chart excerpts retain their plotted values and scales. Full client reports and account details are not included. Results are specific to this hotel, these measures, and these dates.
Questions
Reading the results.
What changed for Gjelina Hotel?
The October 2026 report recorded 2,084 search and AI visits, with a +25% trend since June. Google search clicks reached 1,220, up 30% compared with October 2025. Five of eight selected nonbranded searches improved from June to October.
Are the trend percentages month-over-month growth?
No. The +25% search and AI visit trend, +16% Google click trend, and +35% AI visit trend are the report’s trend measures since June. They are not month-over-month changes or simple June-to-October endpoint growth. The separate +30% Google click figure compares October 2026 with October 2025.
Can the Google clicks, AI visits, and impressions be added together?
No. Search Console clicks, GA4 visits, and Search Console impressions measure different things. The 90 AI visits are already part of the 2,084 search and AI visits. The 10.3K generative AI feature impressions cover a separate six-month view, not October alone.
Does this show how many bookings AI generated?
No. The evidence supplied for this study does not include a booking count or revenue total. Visits and impressions cannot be treated as bookings. The study also does not isolate the effect of our work from seasonality, existing brand demand, or other changes.
Hotel AI visibility
Start with what guests can find today.
See how we approach search and AI visibility for hotels.